Setup Monitor System
This article will guide you through the process of setting up the monitor system for foyer.
foyer provides observability for monitoring in 3 aspects:
- logging: Provides logging in trace/debug/info/warn/error levels with tracing ecosystem.
- metrics: Provides operation counters, operation duration histograms, information gauges with metrics ecosystem.
- tracing: Provide tail-based tracing for slow operation diagnosis with fastrace.
For each ecosystem, there are rich surrounding libraries available. The article will only introduce the example of the most basic configuration. For more details, please refer to the document of each ecosystem.
1. Setup logging monitoring
foyer uses tracing ecosystem for logging monitoring. You can configure the filters and subscribers to control the format, content, and the target for logging.
Here is an example to setup logging monitoring to the console, decorate each log entry with line number, and filter the logs with RUST_LOG syntax.
Add the tracing-subscriber dependencies.
tracing-subscriber = { version = "0.3", features = ["env-filter"] }
Add the following lines at the start of your project.
tracing_subscriber::registry()
    .with(tracing_subscriber::fmt::layer().with_line_number(true))
    .with(EnvFilter::from_default_env())
    .init();
Then everything is set now! Now, you can run your project directly, or with a customized RUST_LOG arguments:
RUST_LOG=foyer_storage::large::generic=trace,info ./your-project-with-foyer
Here is a sample of the outputs:
2024-10-27T08:50:08.631742Z  INFO foyer_bench: 414: [foyer bench]: jemalloc is enabled.
2024-10-27T08:50:08.632902Z  WARN foyer_storage::store: 482: [store builder]: Setting up small object disk cache options, but only large object disk cache is enabled.
2024-10-27T08:50:08.639524Z  INFO foyer_storage::large::recover: 162: Recovers 0 regions with data, 1600 clean regions, 0 total entries with max sequence as 0, initial reclaim permits is 0.
2024-10-27T08:50:08.659042Z TRACE foyer_storage::large::generic: 344: EntryAddress {
    region: 1,
    offset: 8192,
    len: 1420,
    sequence: 19,
}
2024-10-27T08:50:08.660765Z TRACE foyer_storage::large::generic: 344: EntryAddress {
    region: 0,
    offset: 28672,
    len: 638,
    sequence: 41,
}
For more details, please refer to the document of tracing.
2. Setup metrics monitoring
foyer uses metrics ecosystem for metrics monitoring. metrics works like an adapter, foyer uses metrics to define what metrics to collect, and you can use the libraries from the metrics ecosystem to define how and where to collect them. (e.g. Prometheus, StatsD, NewRelic, etc.) Please refer to the README and document
This section will take integrating with Prometheus as an example.
To integrate Prometheus,the trivial method is using the metrics-exporter-prometheus offered by metrics.
First, add the dependency to your project:
metrics-exporter-prometheus = "0.15"
Then setup the prometheus exporter.
let addr: SocketAddr = "0.0.0.0:19970".parse().unwrap();
PrometheusBuilder::new()
    .with_http_listener(addr)
    .set_buckets(&[0.000_001, 0.000_01, 0.000_1, 0.001, 0.01, 0.1, 1.0])
    .unwrap()
    .install()
    .unwrap();
However, some project may have already using lib prometheus to export data. In this case, it is recommended to use metrics-prometheus as an adapter between lib metrics and prometheus.
First, add metrics-prometheus as an dependency to your project:
metrics-prometheus = "0.7"
Then set the registry your project is using with prometheus as the target of metrics that foyer uses with metrics-prometheus.
// For example, `GLOBAL_METRICS_REGISTRY` is the registry your project is using with lib `prometheus`.

metrics_prometheus::Recorder::builder()
    .with_registry(GLOBAL_METRICS_REGISTRY.clone())
    .build_and_install();
Then export the registry like your project does before.
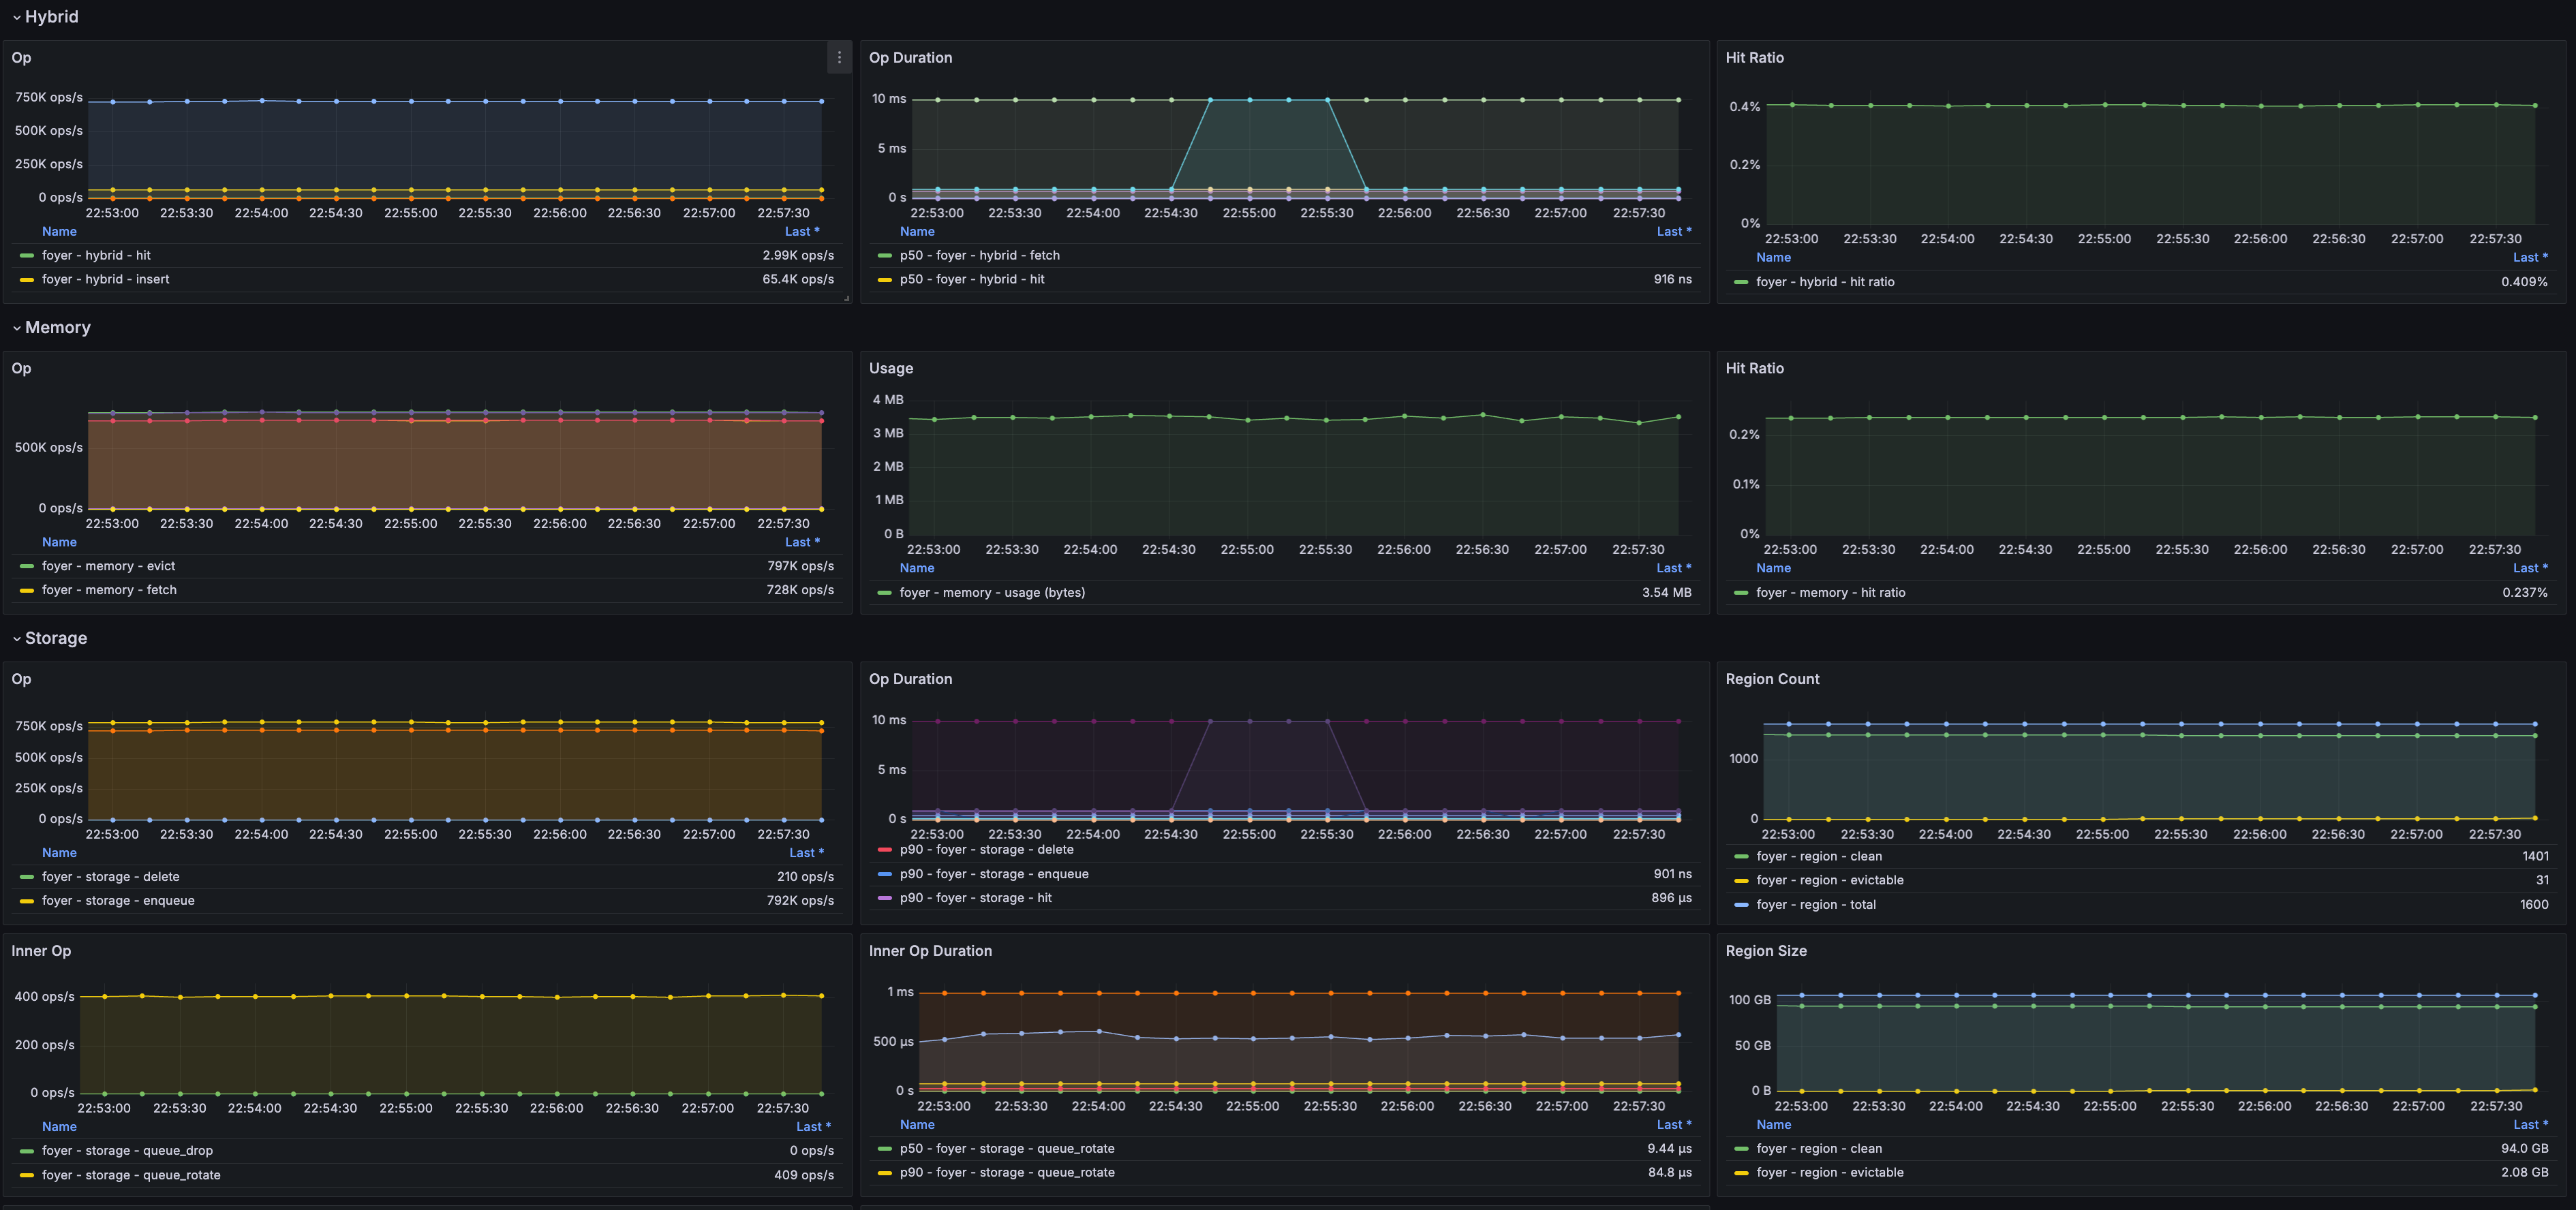
After collecting data with Prometheus, you can setup Grafana to display the metrics.
Here is an example of some exported metrics.

3. Setup tracing monitoring
TBC ... ...